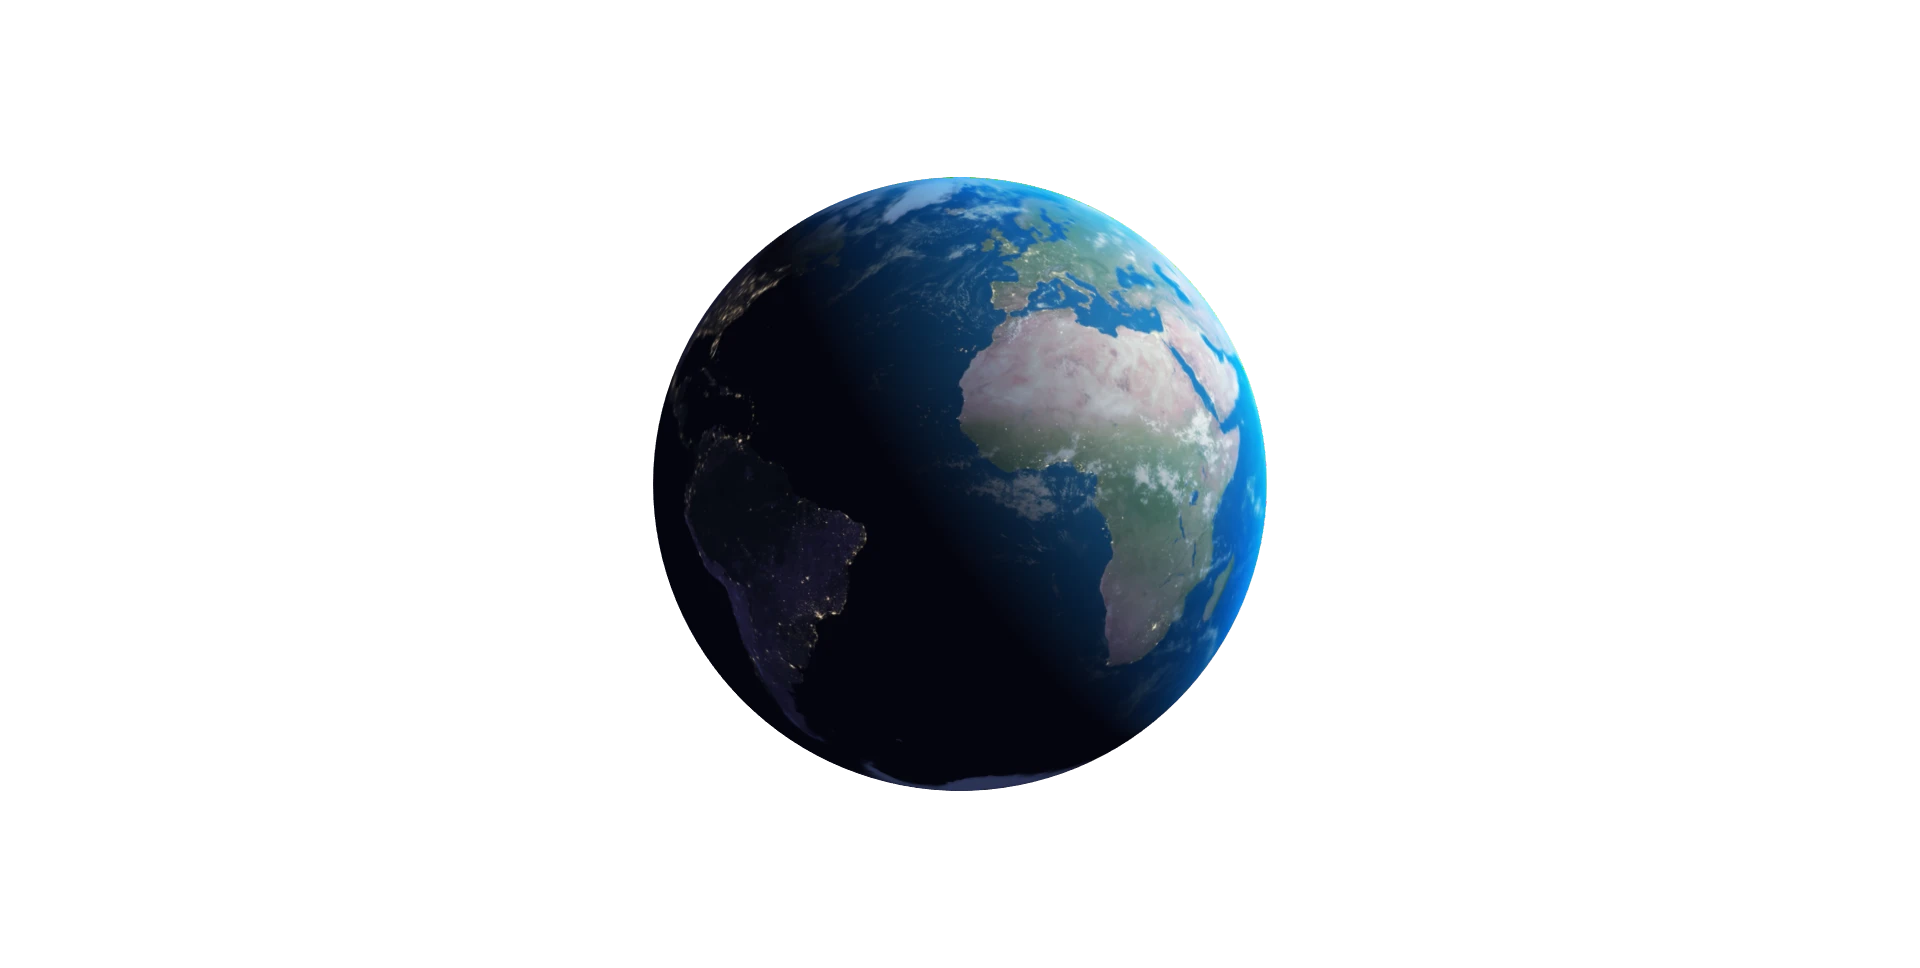
Spatial data analytics · Canberra, Australia
Earth data,
lightning fast
Who we are
Earth data was built for specialists and supercomputers. We built Haizea Analytics to close that gap.
You understand your problem; we understand the data. We work together to find the answers.
Transparent · traceable · validated against ground truth
The full story — company brochure (PDF) →What we do
From one-off study to standing capability
You don’t need Earth observation. You need the answers it contains.
01
Ask in your own terms
A property, a catchment, a season — not datasets and projections.
02
Answers that stay current
As new observations arrive, the answer updates.
03
Delivered the way you work
A report, a live map, or a feed into your systems.
04
Nothing to build
No cluster, no specialists. Pay for answers, not capacity.
- Risk management
Detect change early enough to act on it.
- Compliance
Monitor continuously, without anyone on the ground.
- Due diligence
Back a valuation or claim with spatial evidence.
- Operations
Analysis and reporting that runs on its own.
Explore Our Case Studies
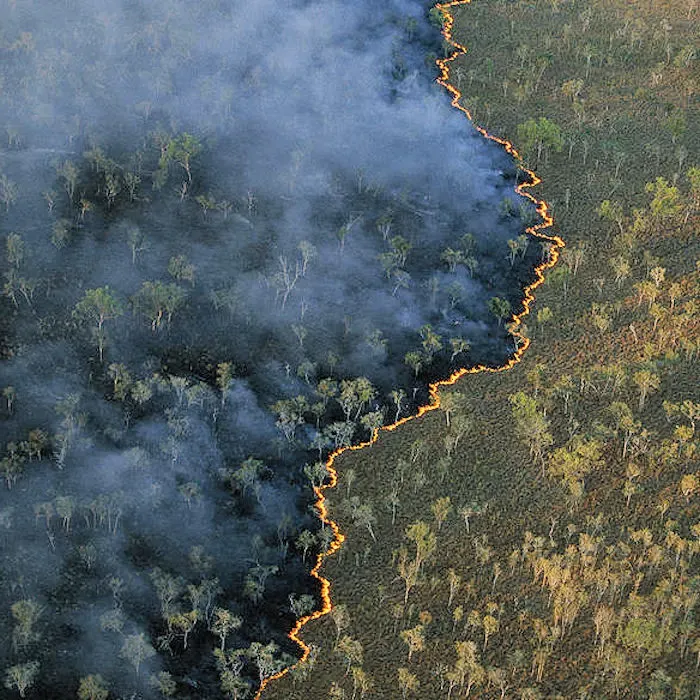
Continental bushfire intelligence with an AI agent
OzHazard — Terrakio Agent in production

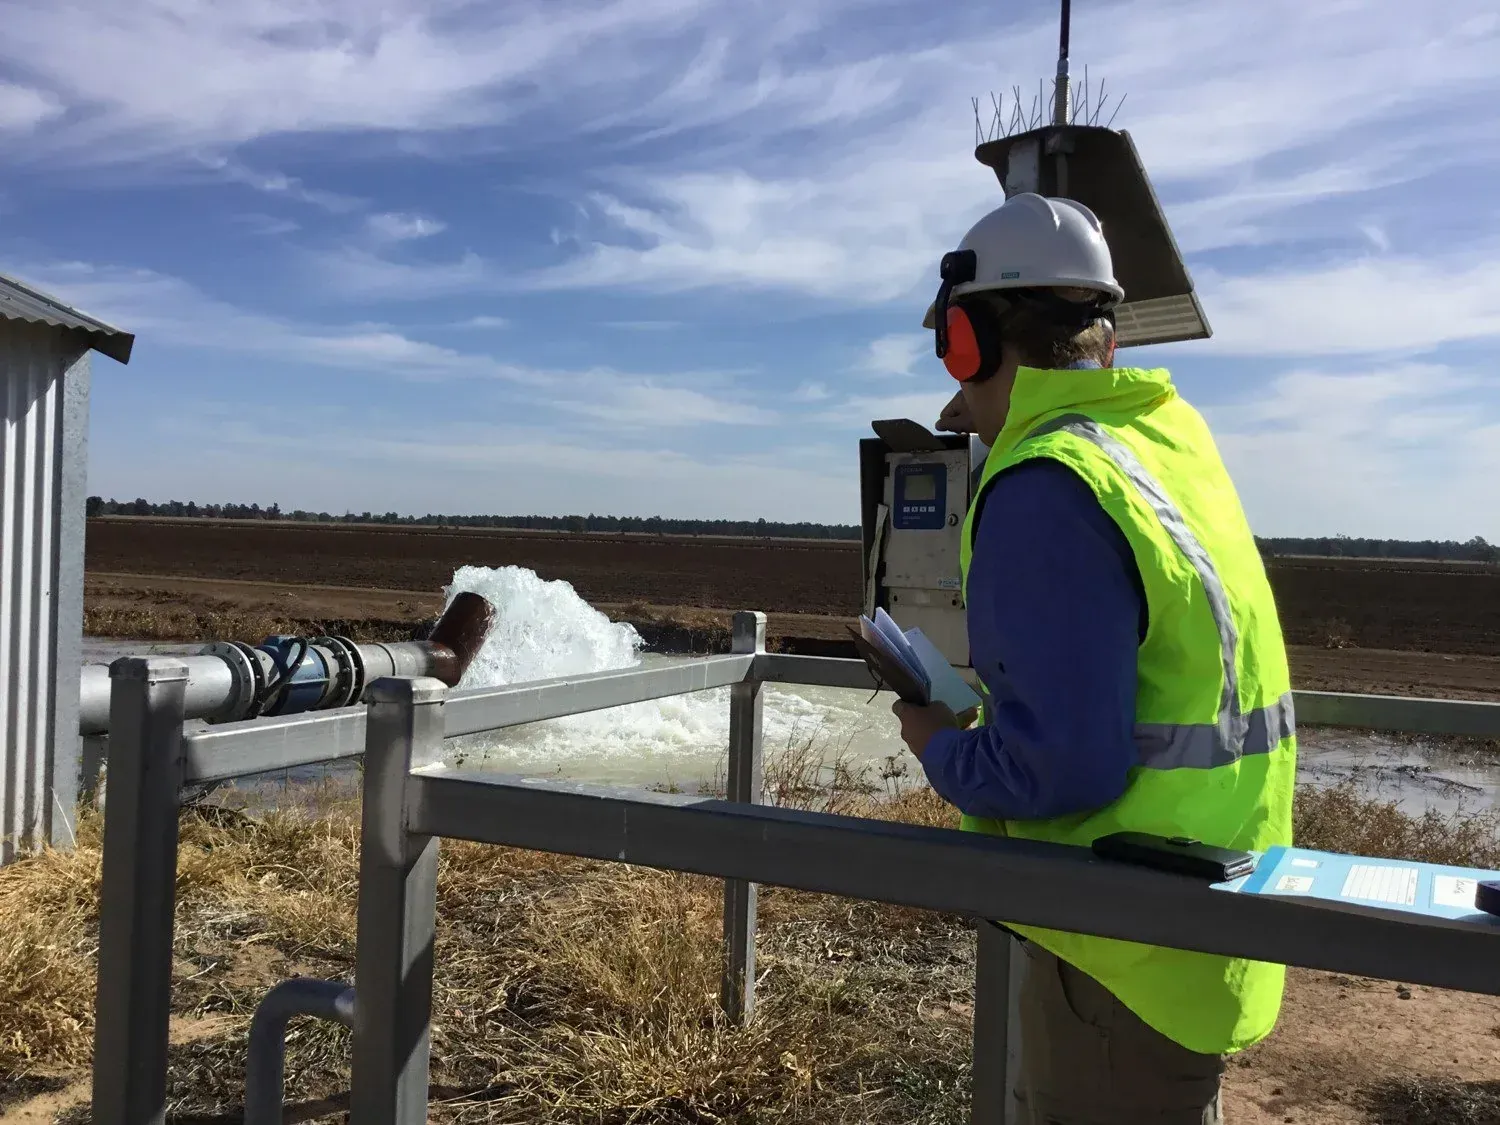
Water license compliance monitoring in NSW
Government Water Authority
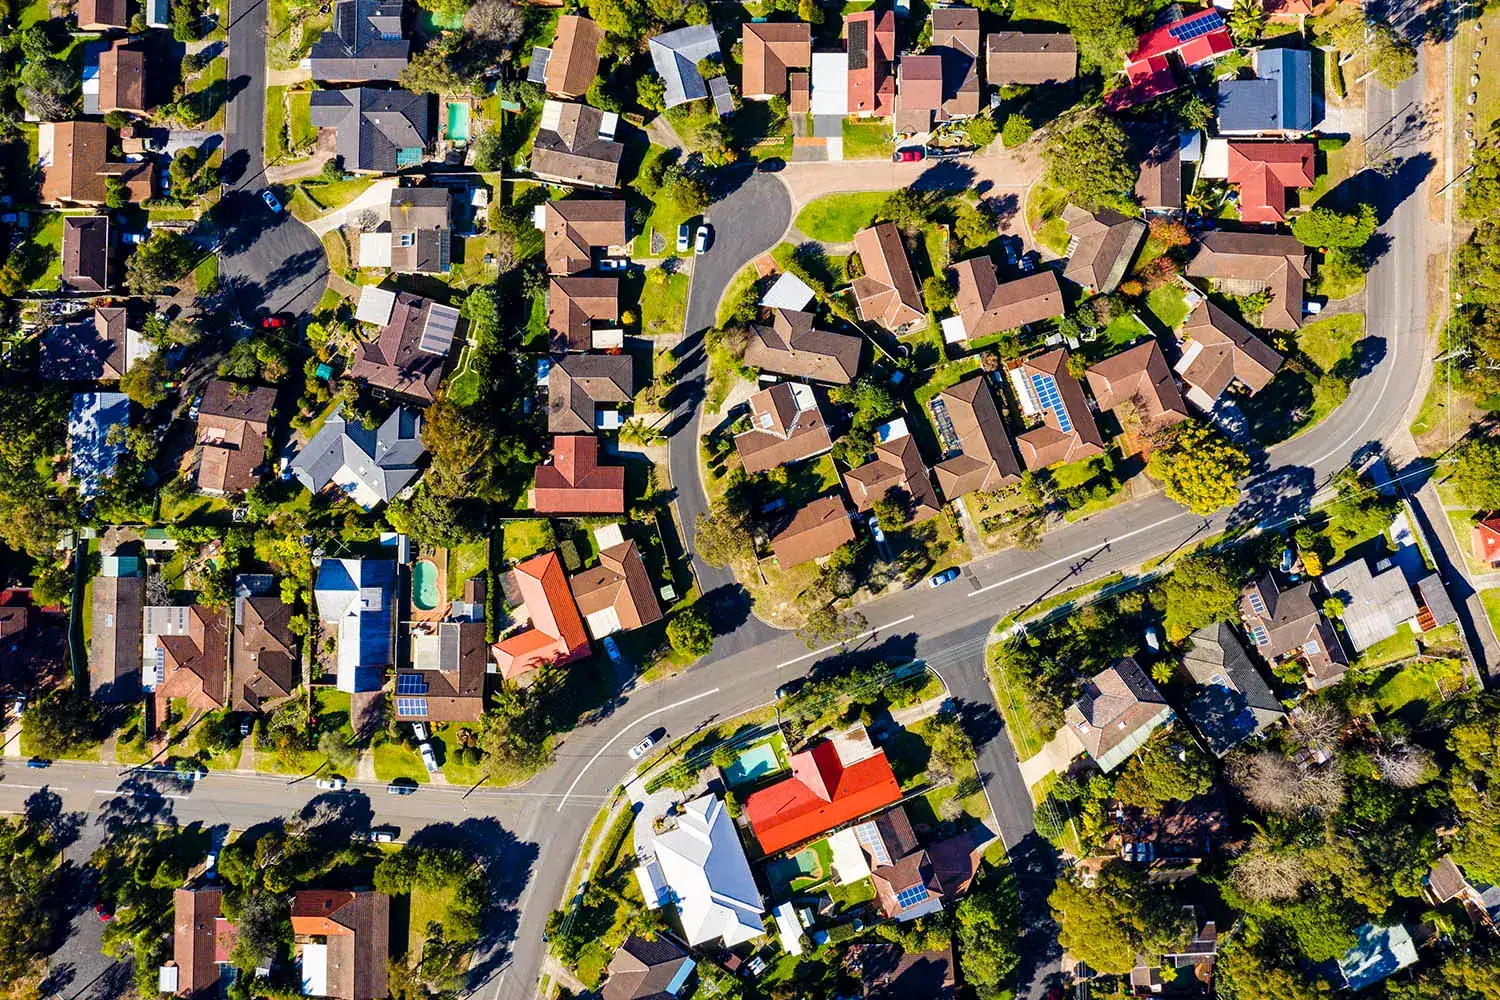
Evidence-based environmental policy in the ACT
ACT Government Sustainability
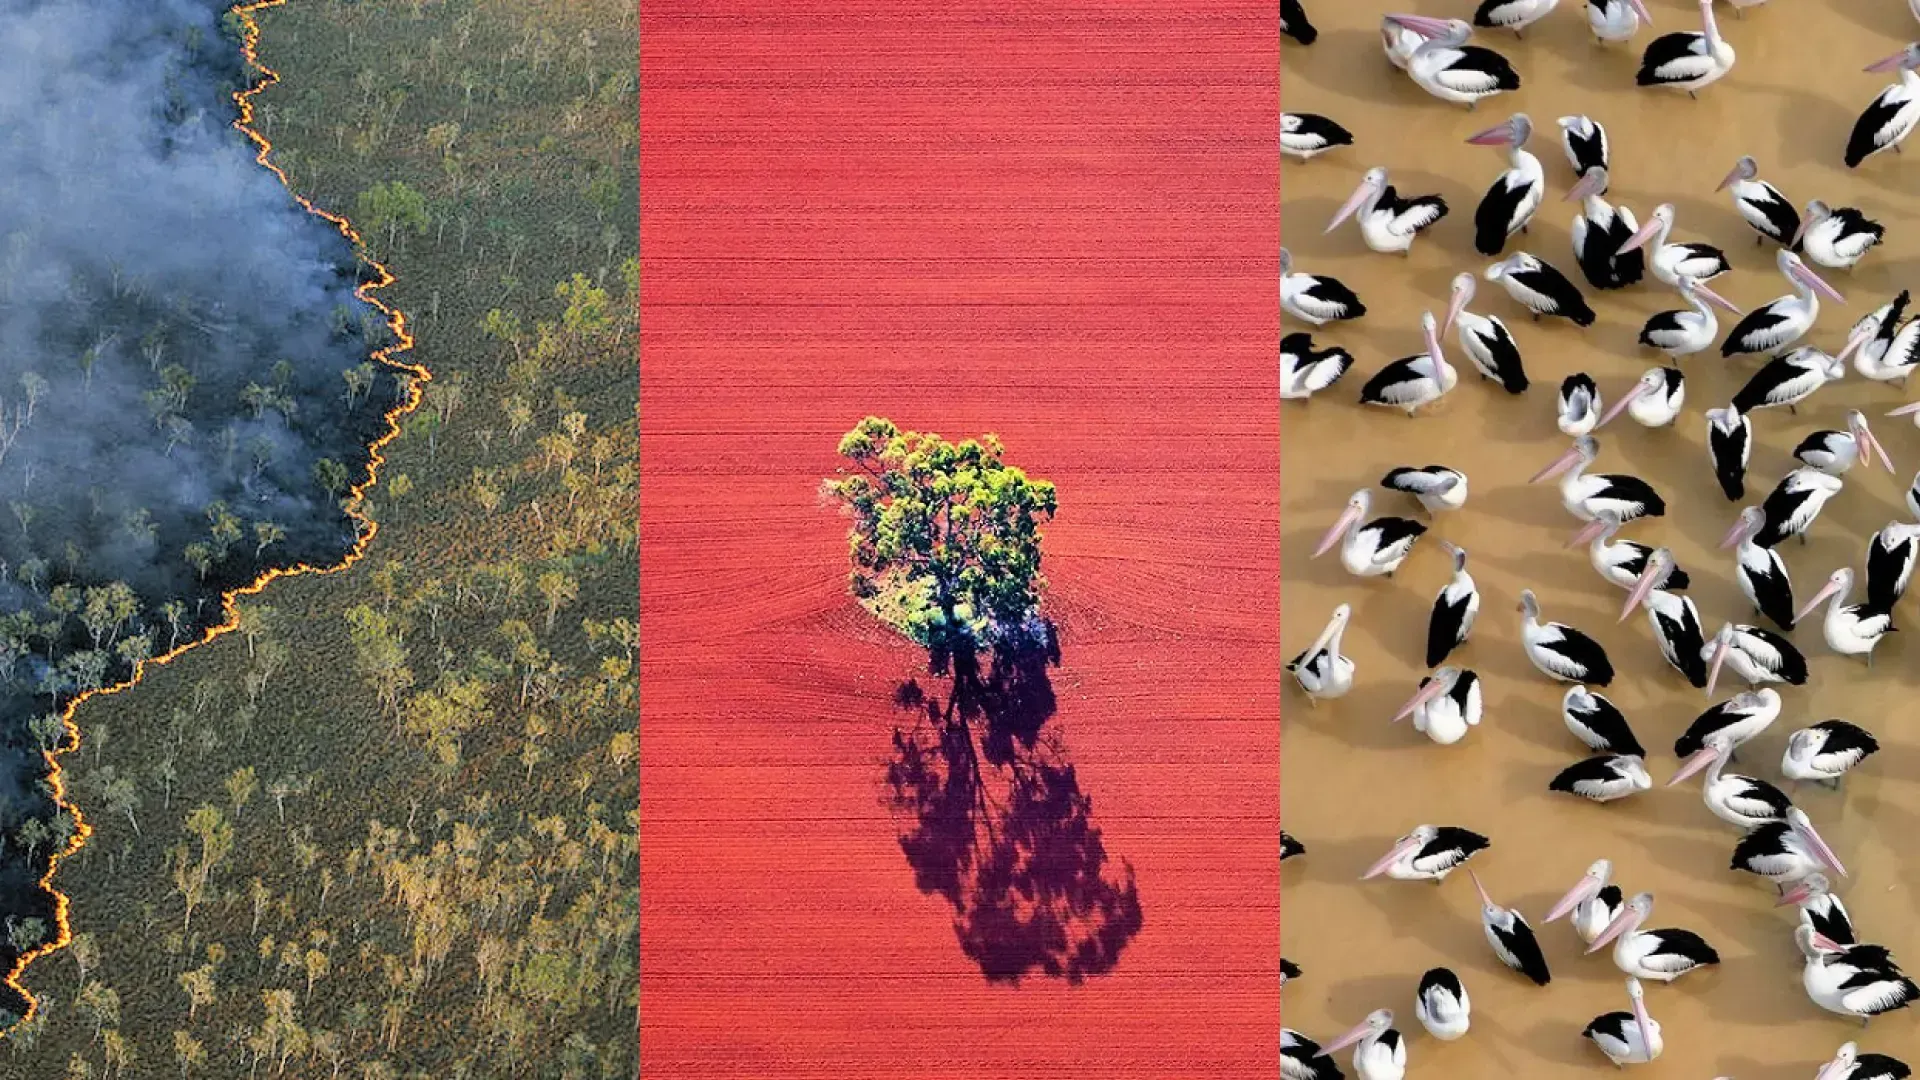
Annual environmental reporting across Australia
TERN & ANU Environmental Monitoring
Different problems, different scales — one engine.
Who we serve
Who we work with
Different sectors, one shared need: knowing what’s happening across more ground than anyone can cover.
Resources
Water authorities, land agencies, agribusiness — use and compliance at scale.
Hazards
Fire and flood agencies — scattered detections become early situational awareness.
Environment
Agencies and NGOs tracking vegetation, forests, and biodiversity over time.
Land and property
Buyers, insurers, and land managers — evidence at single-property level.
Full service catalogue — in the brochure (PDF) →
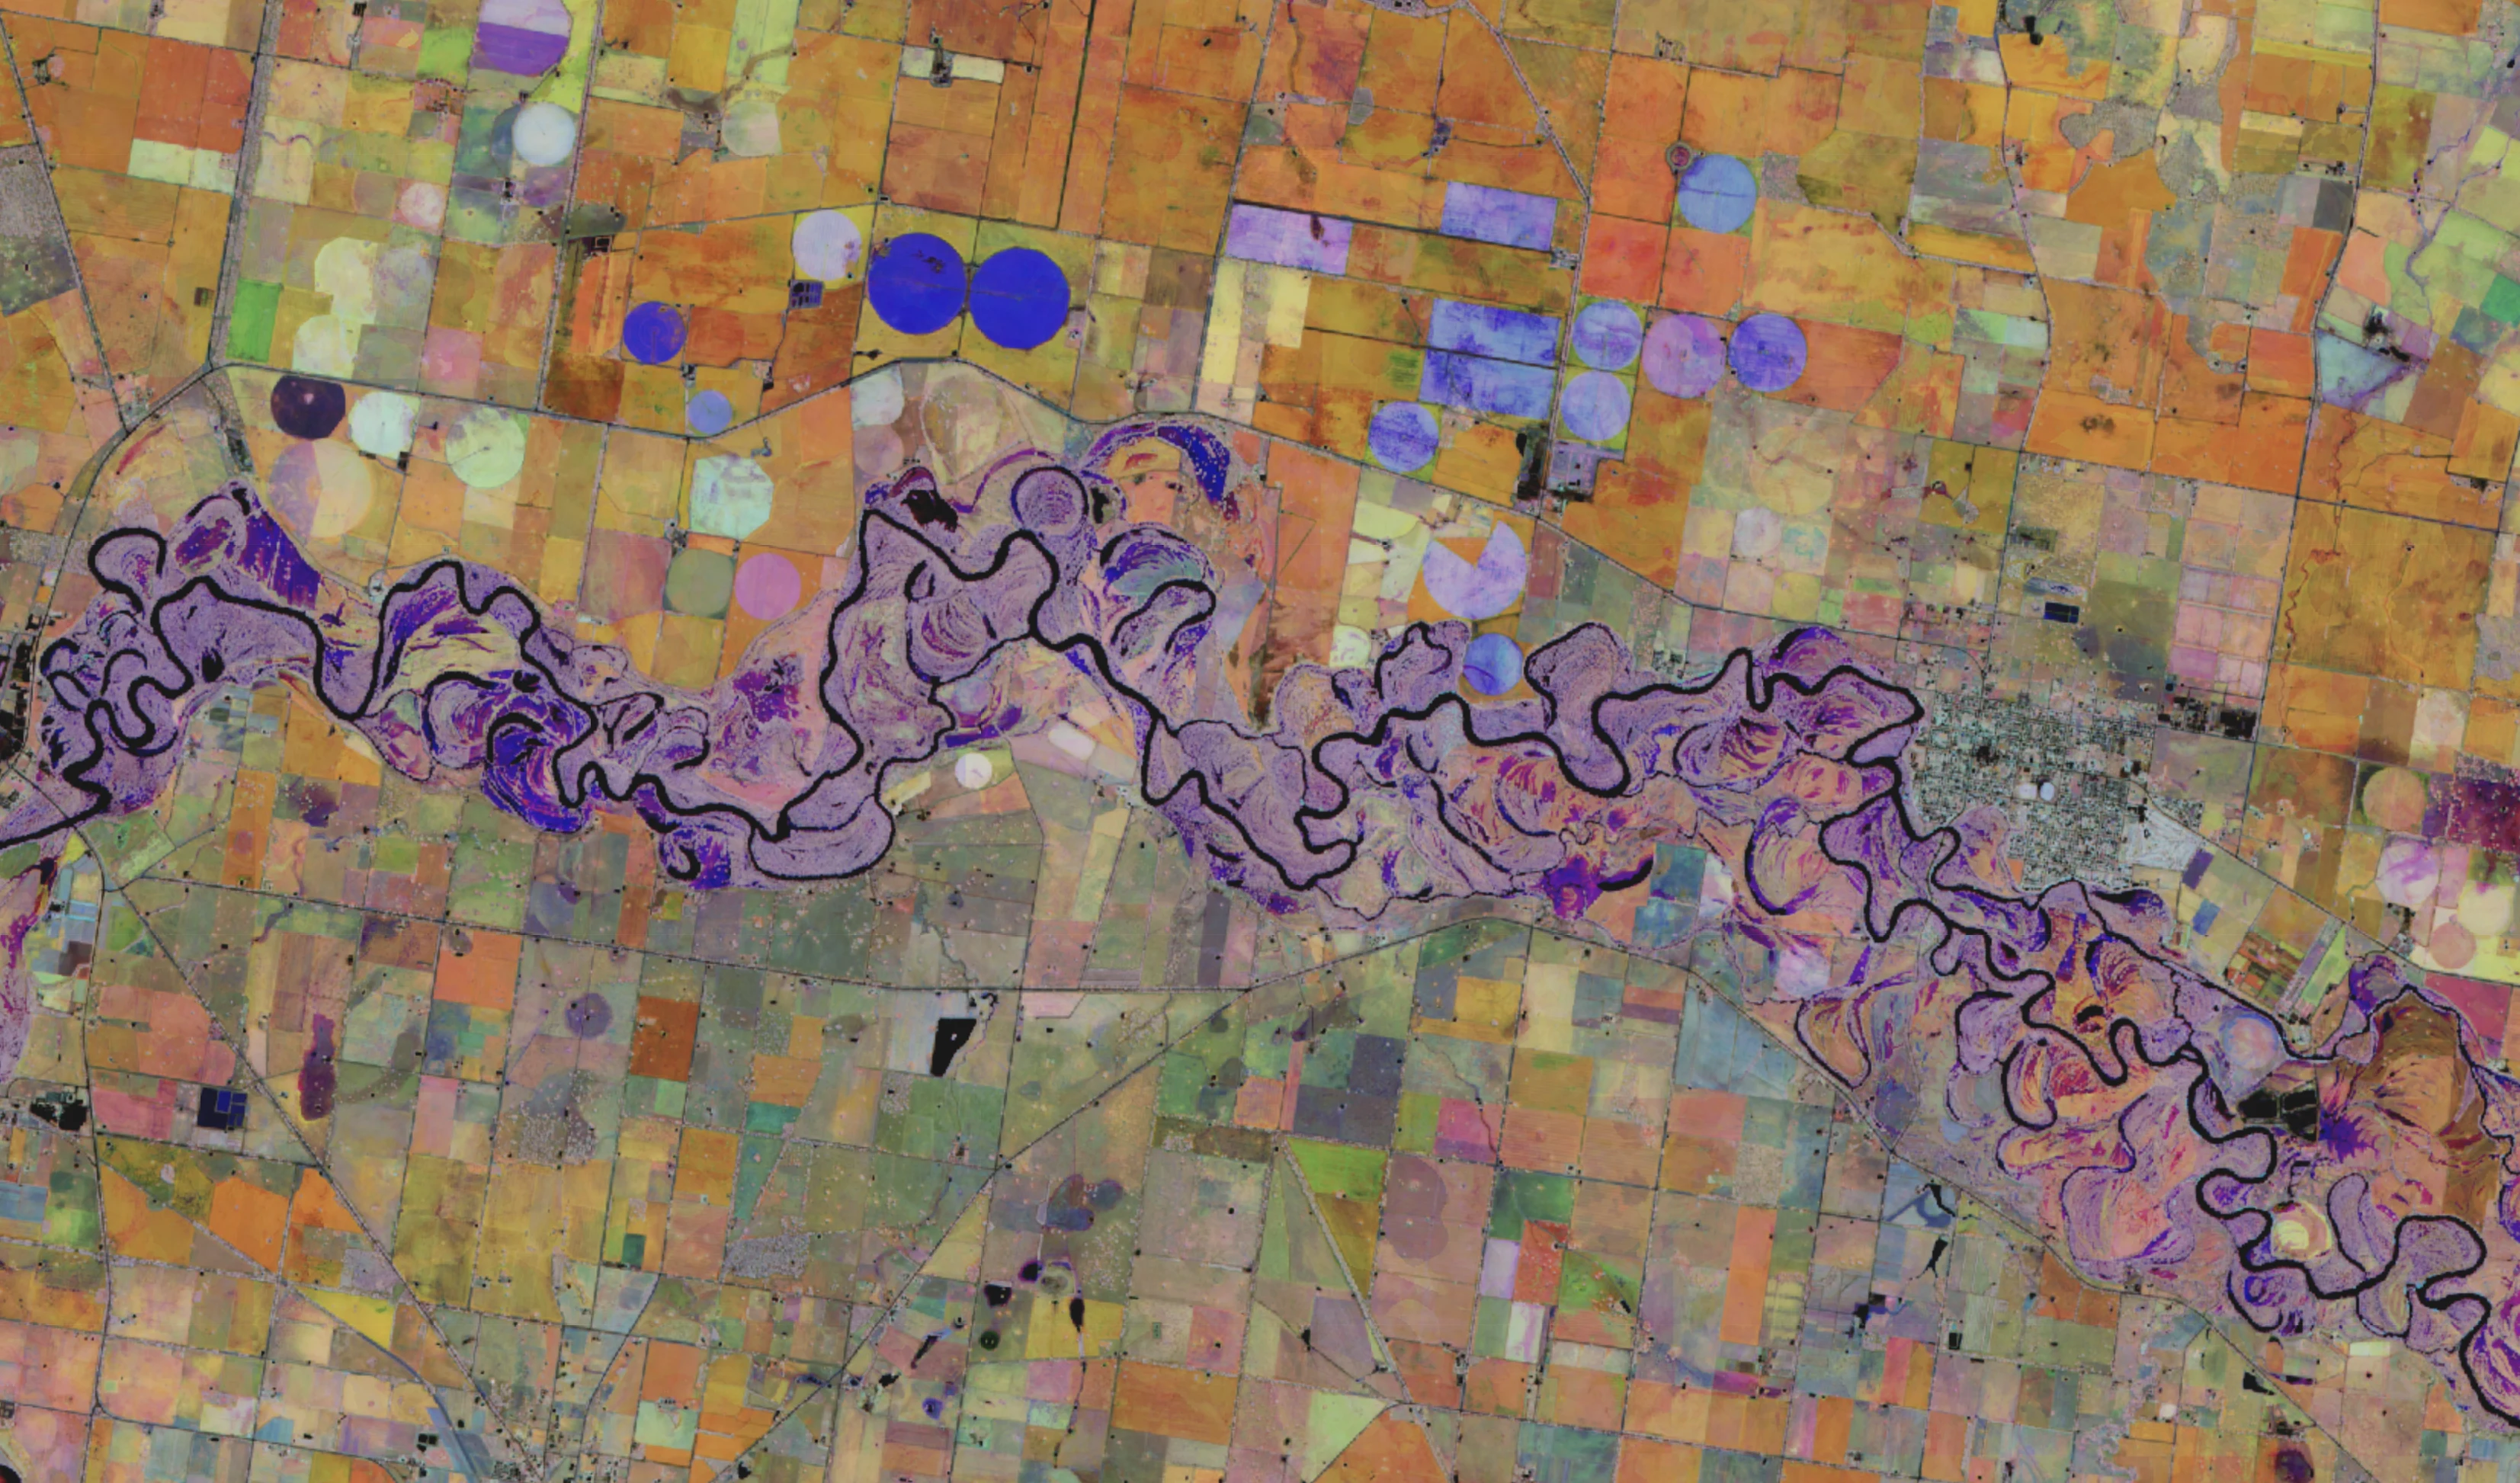
Our platform
From raw observations to answers
One curated archive, one engine. You ask a question; the answer comes back.
Data foundation
The living archive
150+ datasets · aligned · validated · decades deep
The engine
Terrak.io
Any question, however large — answered in seconds
Ask your own questions
150+ datasets, your own indices and thresholds.
Bring your own data
Your layers, analysed alongside the archive.
Any format
Map tiles, GeoTIFFs, JSON, spreadsheets.
Any scale
A paddock over decades, or a continent in one figure.
Analysis-ready, before and after
Drag to compare — the raw archive against the answer. Or try the Terrak.io Playground.
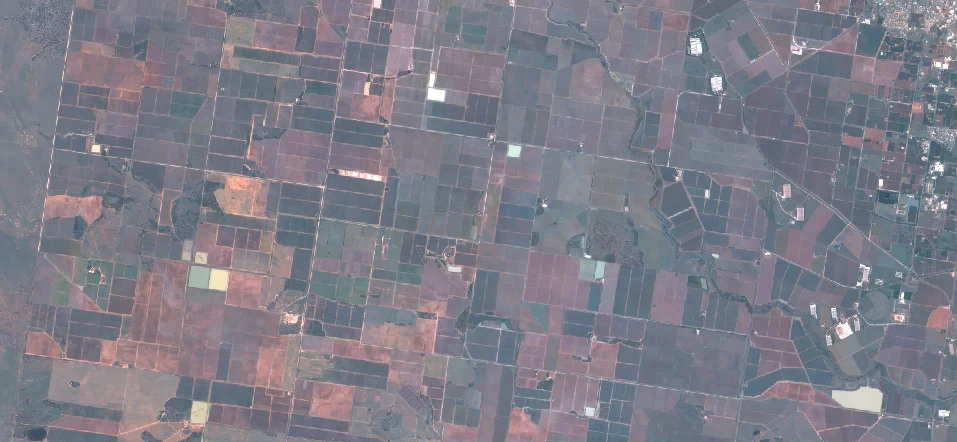
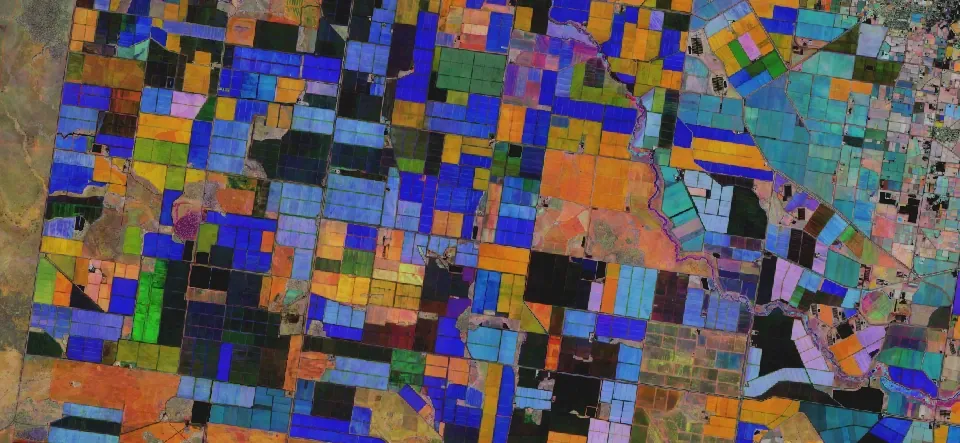
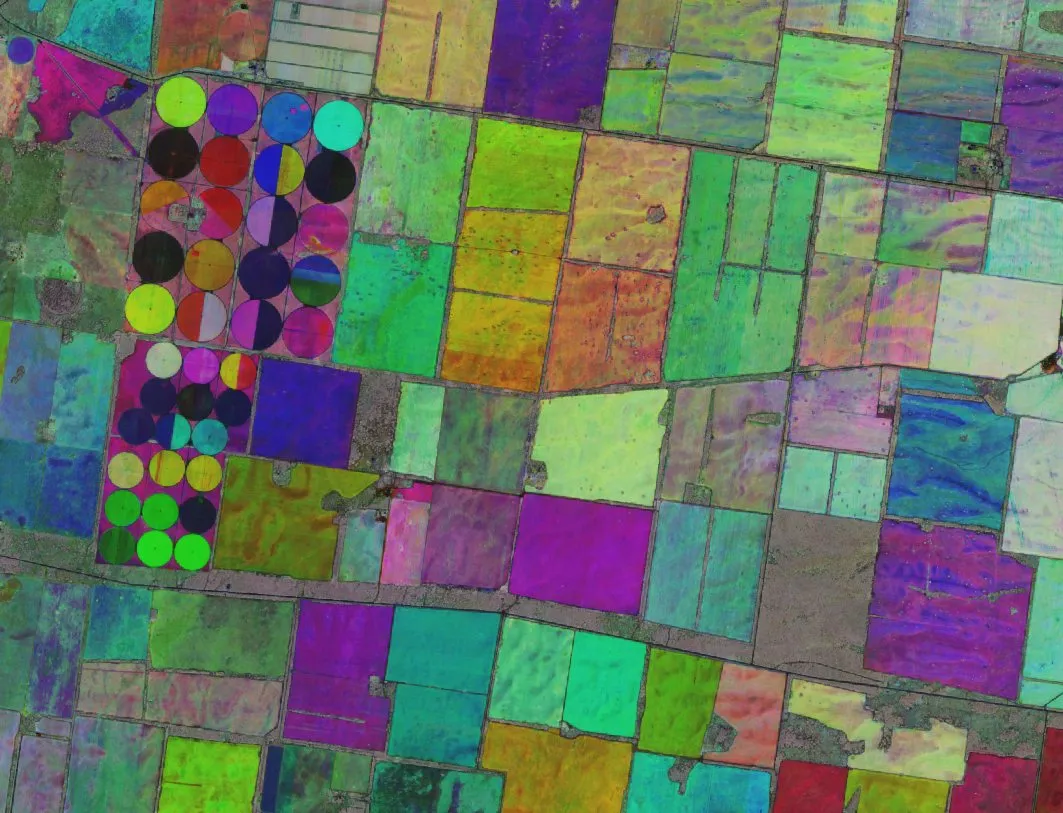
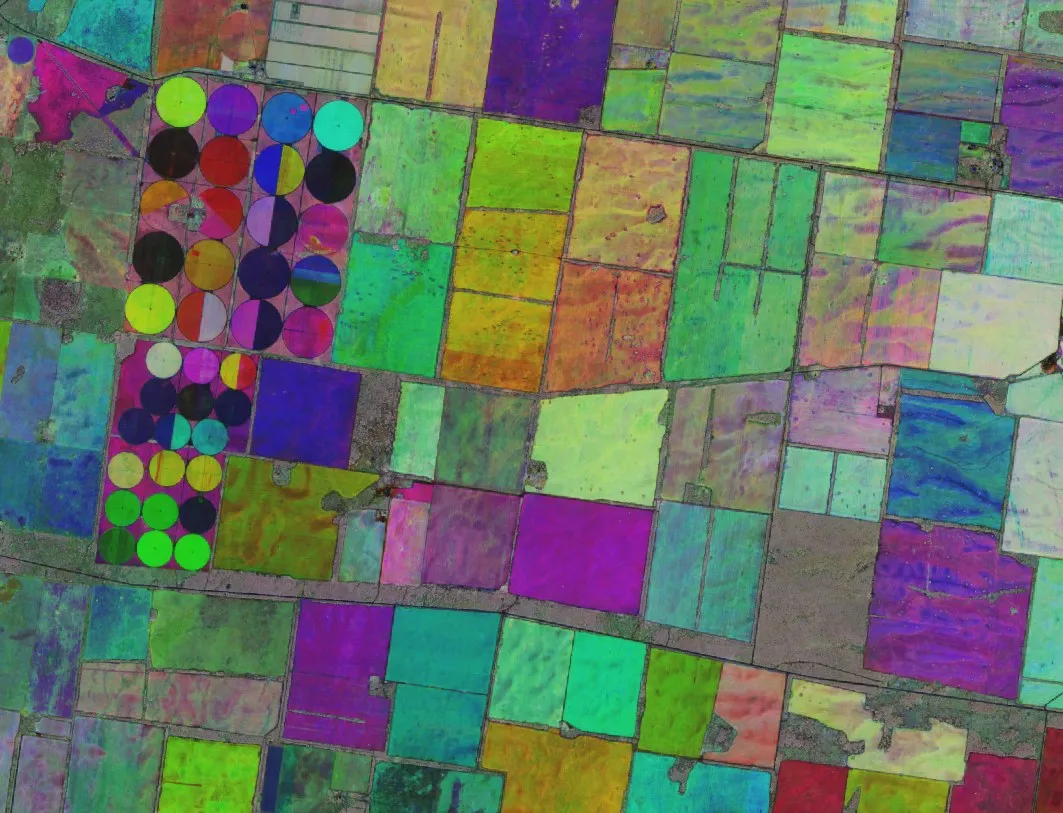
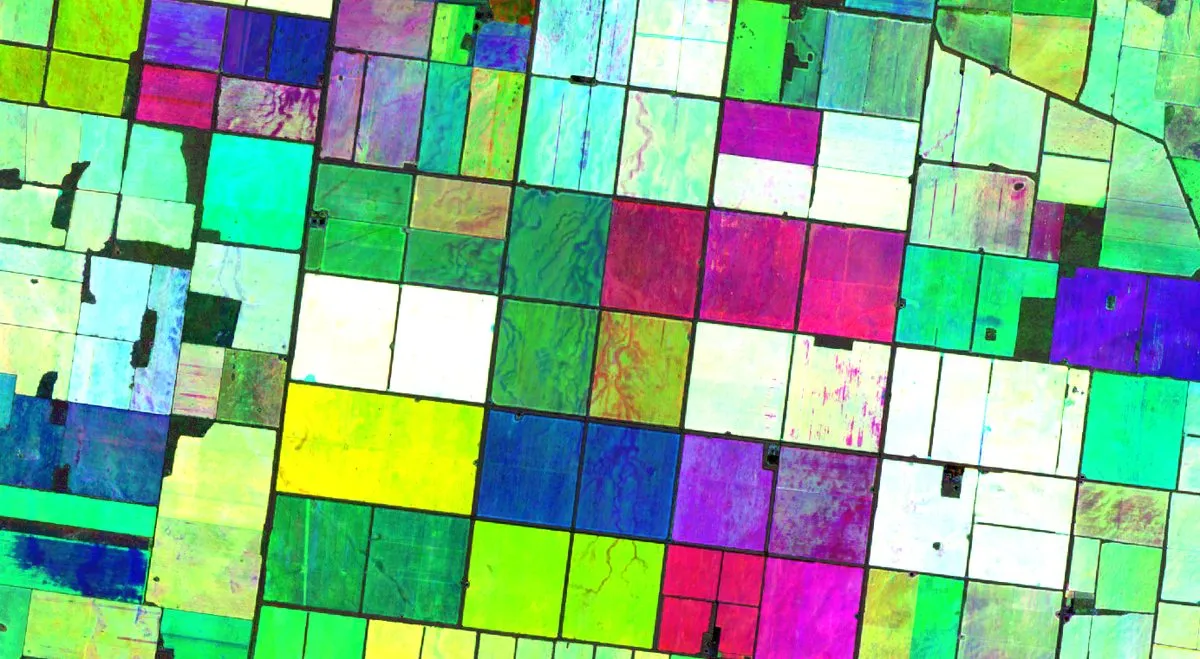
Crop type and field mapping from Sentinel-2
Left: a season of analysis-ready Sentinel-2 over southern NSW. Right: each parcel coloured by its crop cycle.
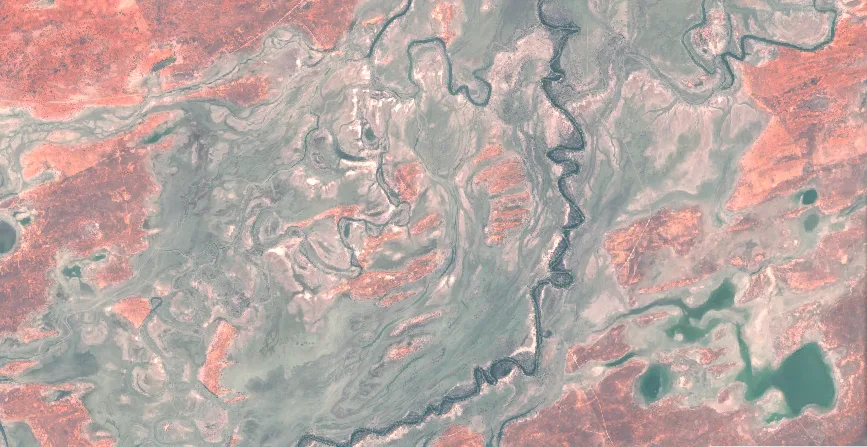

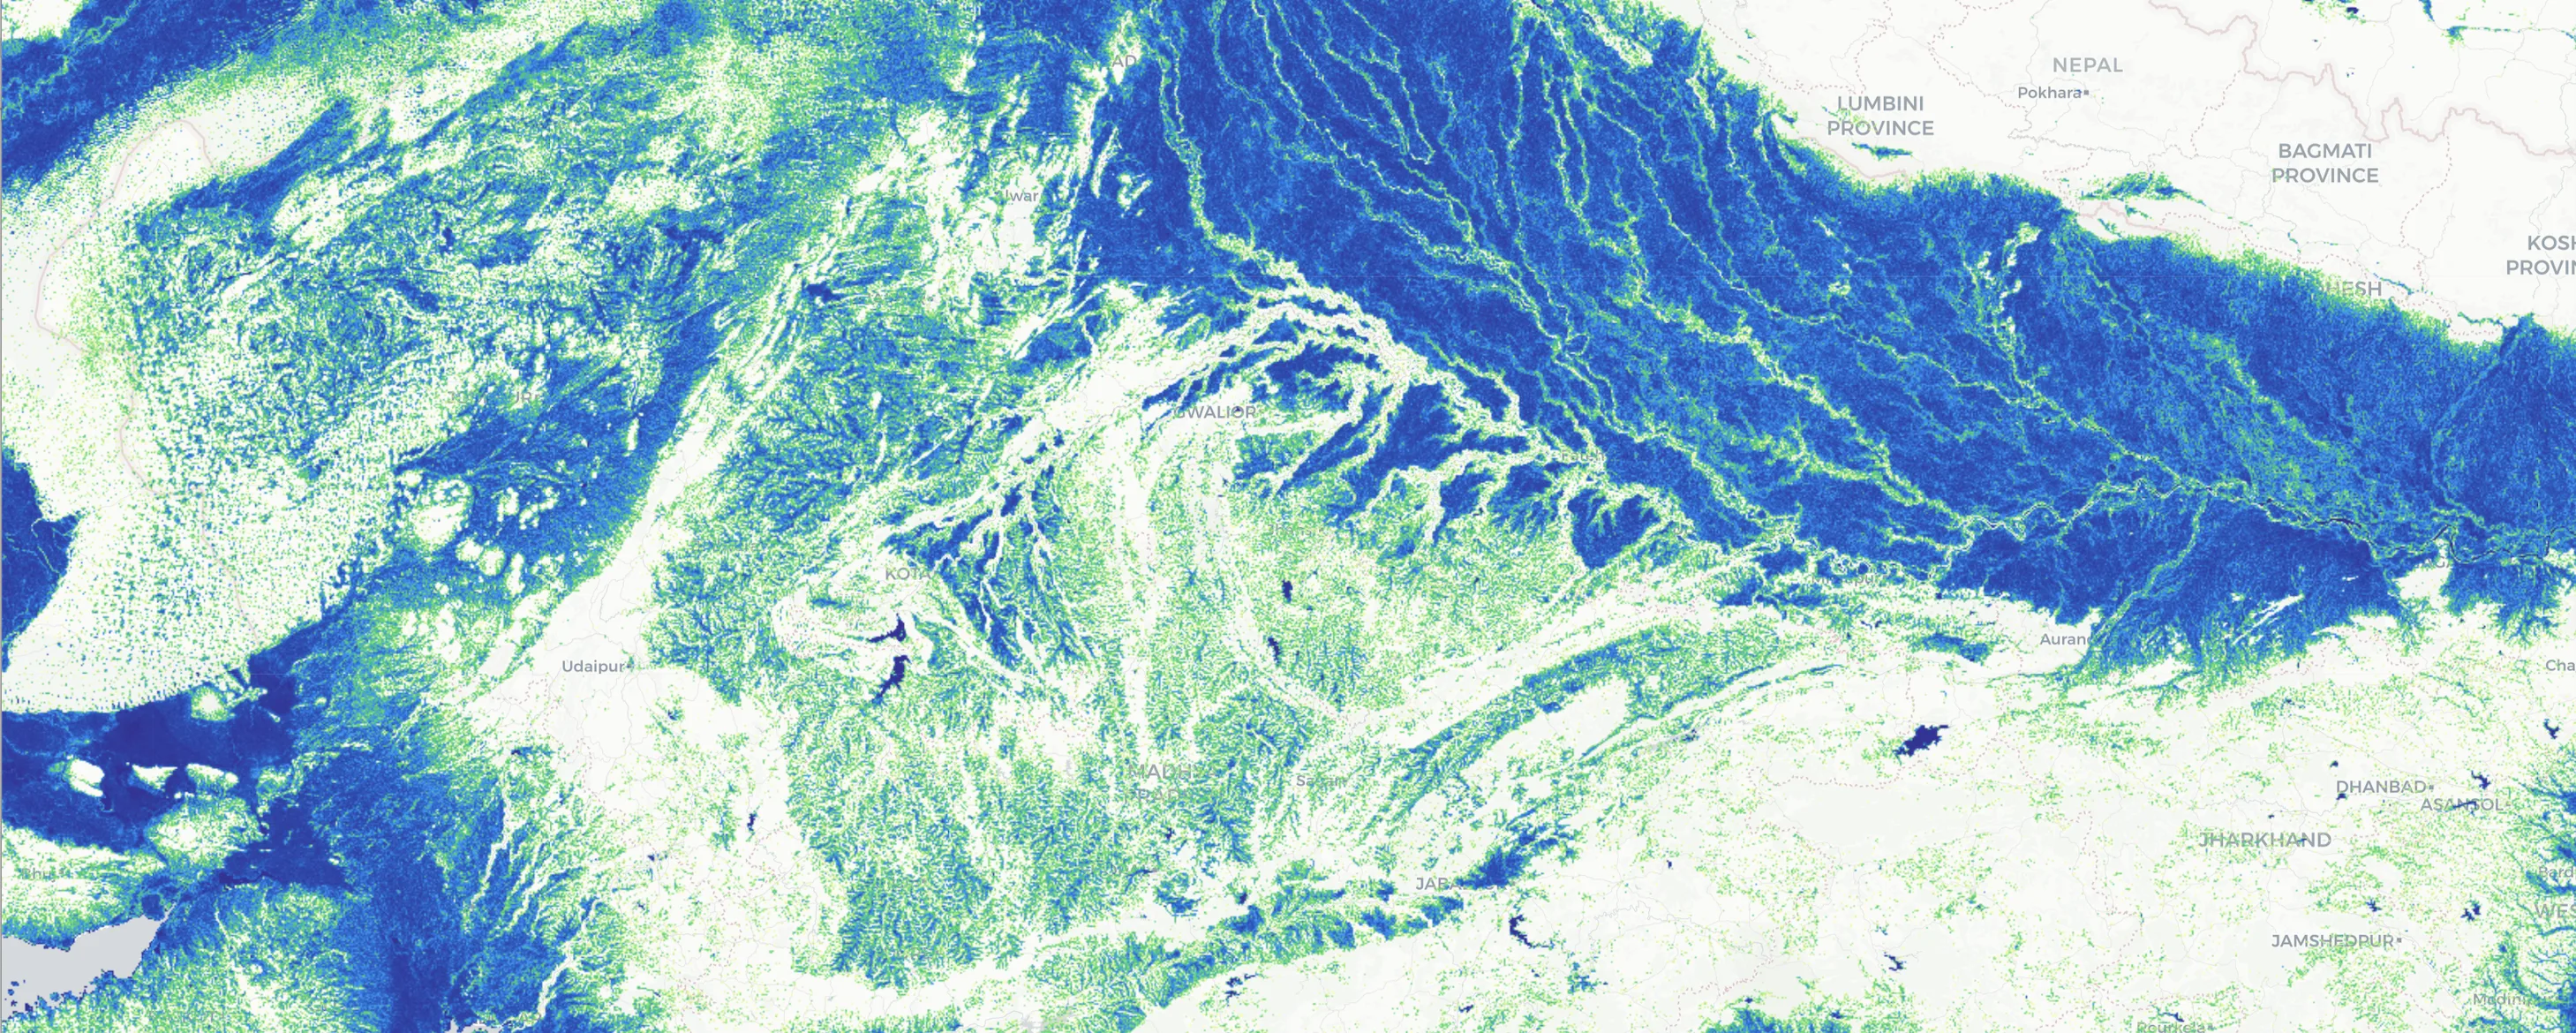
Days flood duration from Sentinel-2 imagery
Left: five months of Sentinel-2 along the Darling River. Right: days of flood duration.
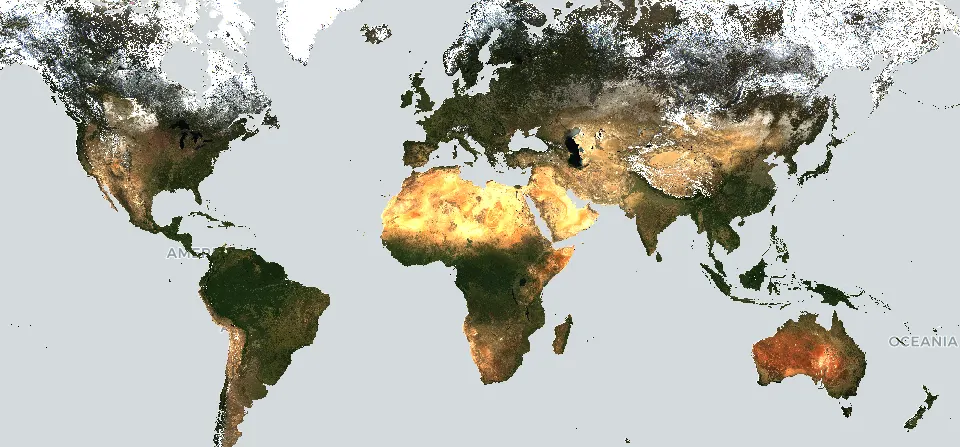
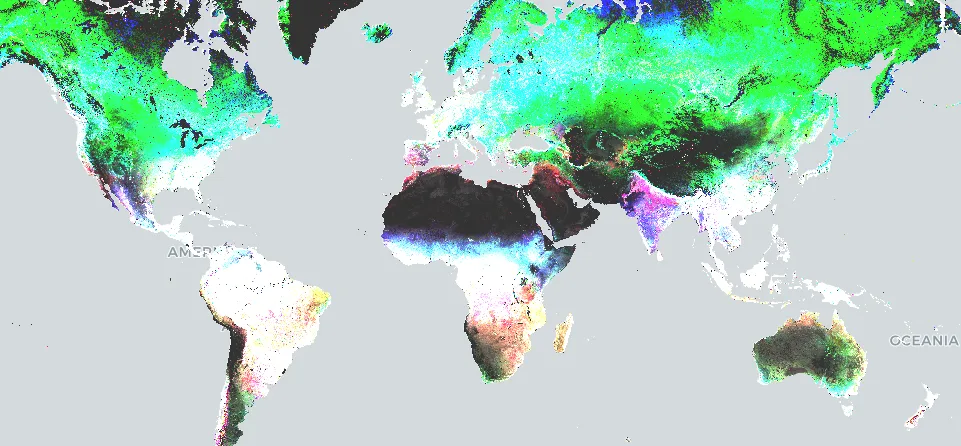
Global vegetation seasonality from MODIS
Left: median MODIS imagery for 2023. Right: when vegetation peaks — red for February, green for June, blue for October.
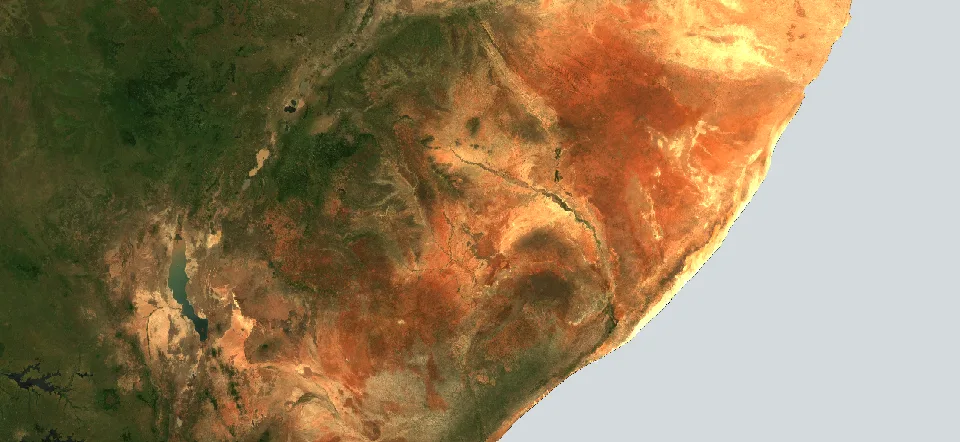
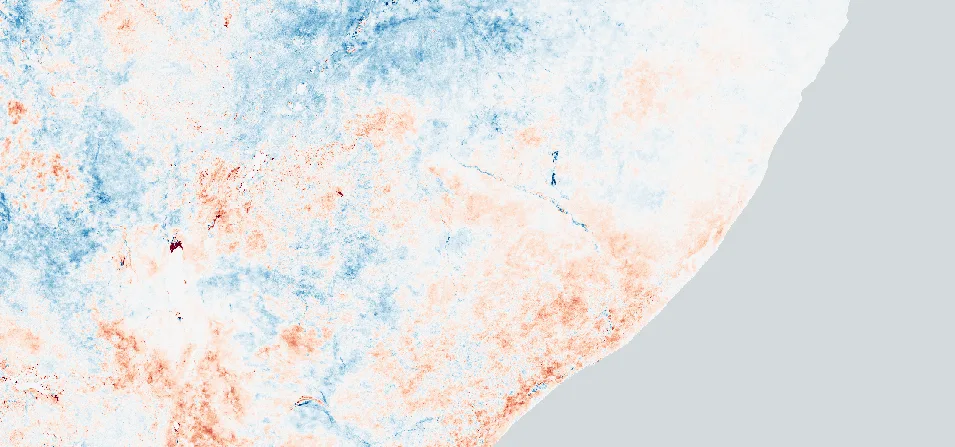
Drought monitoring using MODIS
Left: median MODIS over the Horn of Africa, 2023. Right: drought impacts in red.
Scientific rigour
Answers that stand up
Our answers end up in compliance cases, valuations, and public reports.
01
Research, made operational
Peer-reviewed methods, engineered to continental scale.
02
Measured against reality
Validated against gauges, field sensors, and airborne LiDAR.
03
Uncertainty stated
You know how far to trust a result.
04
Traceable to source
Missions, dates, and methods travel with every answer.
Science you can check, in answers you can defend.

The people behind the answers
Science and engineering, working as one
The people who understand landscapes, working with the people who can interrogate the data.
Two decades of continental-scale environmental research at the Australian National University became Haizea.
Dr Pablo Rozas Larraondo
Co-founder · AI and geospatial engineering
AI scientist; architect of the technology behind Terrak.io.
Professor Albert Van Dijk
Co-founder · Environmental science
Professor of Water Science at the ANU; founded the Centre for Water and Landscape Dynamics.
Haizea Analytics Pty Ltd · Founded 2021 · Canberra ACT · ABN 27 648 451 969
What comes next?
It all starts with a conversation.
Start with the question
What do you need to decide?
Test what's possible
One place, one question, one answer.
Build it together
Your expertise, our science and engineering.
Make it operational
The answer grows into a capability.
Visit
Gould Building (B116) Daley RoadCanberra ACT 2600
Australia
Get in touch
contact@haizea.com.au
haizea.com.au
ABN 27 648 451 969
Download the company brochure (PDF) · Technical documentation available on request